NestJS Memory Leak Demo
This documentation describes the NestJS demo application for testing and demonstrating various types of memory leaks in Node.js/TypeScript environments.
Overview
The NestJS demo provides interactive API endpoints to simulate different memory leak patterns commonly found in Node.js applications. This hands-on approach helps developers understand how memory leaks manifest and how to detect them using V8 heap dump analysis.
Getting Started
Prerequisites
- Node.js 22+
- pnpm
- Basic understanding of REST APIs
Installation
cd nodejs/nestjs-demo
pnpm install
pnpm run start:dev
📖 Quick Setup: For rapid setup and API reference, see the project README.md
🎯 This Guide: Focuses on educational content and comprehensive heap dump analysis
Base URL
http://localhost:3000Available Memory Leak Patterns
The demo supports 5 different memory leak patterns:
1. Timer Leaks
- Pattern: Uncleaned setTimeout/setInterval objects
- API:
/memory-leak/timer/* - Memory Impact: Timer objects accumulate in memory
2. Cache Leaks
- Pattern: Unlimited cache growth without eviction
- API:
/memory-leak/cache/* - Memory Impact: ~8MB per cache entry
3. Closure Leaks
- Pattern: Functions holding large data in scope
- API:
/memory-leak/closure/* - Memory Impact: 10MB per closure function
4. Event Listener Leaks
- Pattern: EventEmitter listeners never removed
- API:
/memory-leak/event/* - Memory Impact: 8MB per listener
5. Global Variable Leaks
- Pattern: Global objects growing indefinitely
- API:
/memory-leak/global-variable/* - Memory Impact: ~8MB per global array
Health Check
GET /health/ready
Check if the application is ready to receive requests.
Response:
{
  "status": "ok"
}
🔍 V8 Heap Dump Analysis
This section provides detailed guidance on analyzing memory leaks using V8 heap dumps and Chrome DevTools.
Prerequisites for Analysis
- Chrome Browser (for DevTools)
- Node.js with
--inspectflag enabled - Basic understanding of JavaScript objects and references
Setup for Heap Dump Analysis
1. Start Application with Inspector
# Start the NestJS demo with inspector enabled
cd nodejs/nestjs-demo
node --inspect=0.0.0.0:9229 dist/main.js

# Or in development mode
pnpm run start:debug
2. Connect Chrome DevTools
Open Chrome browser
Navigate to
chrome://inspectClick "Open dedicated DevTools for Node"
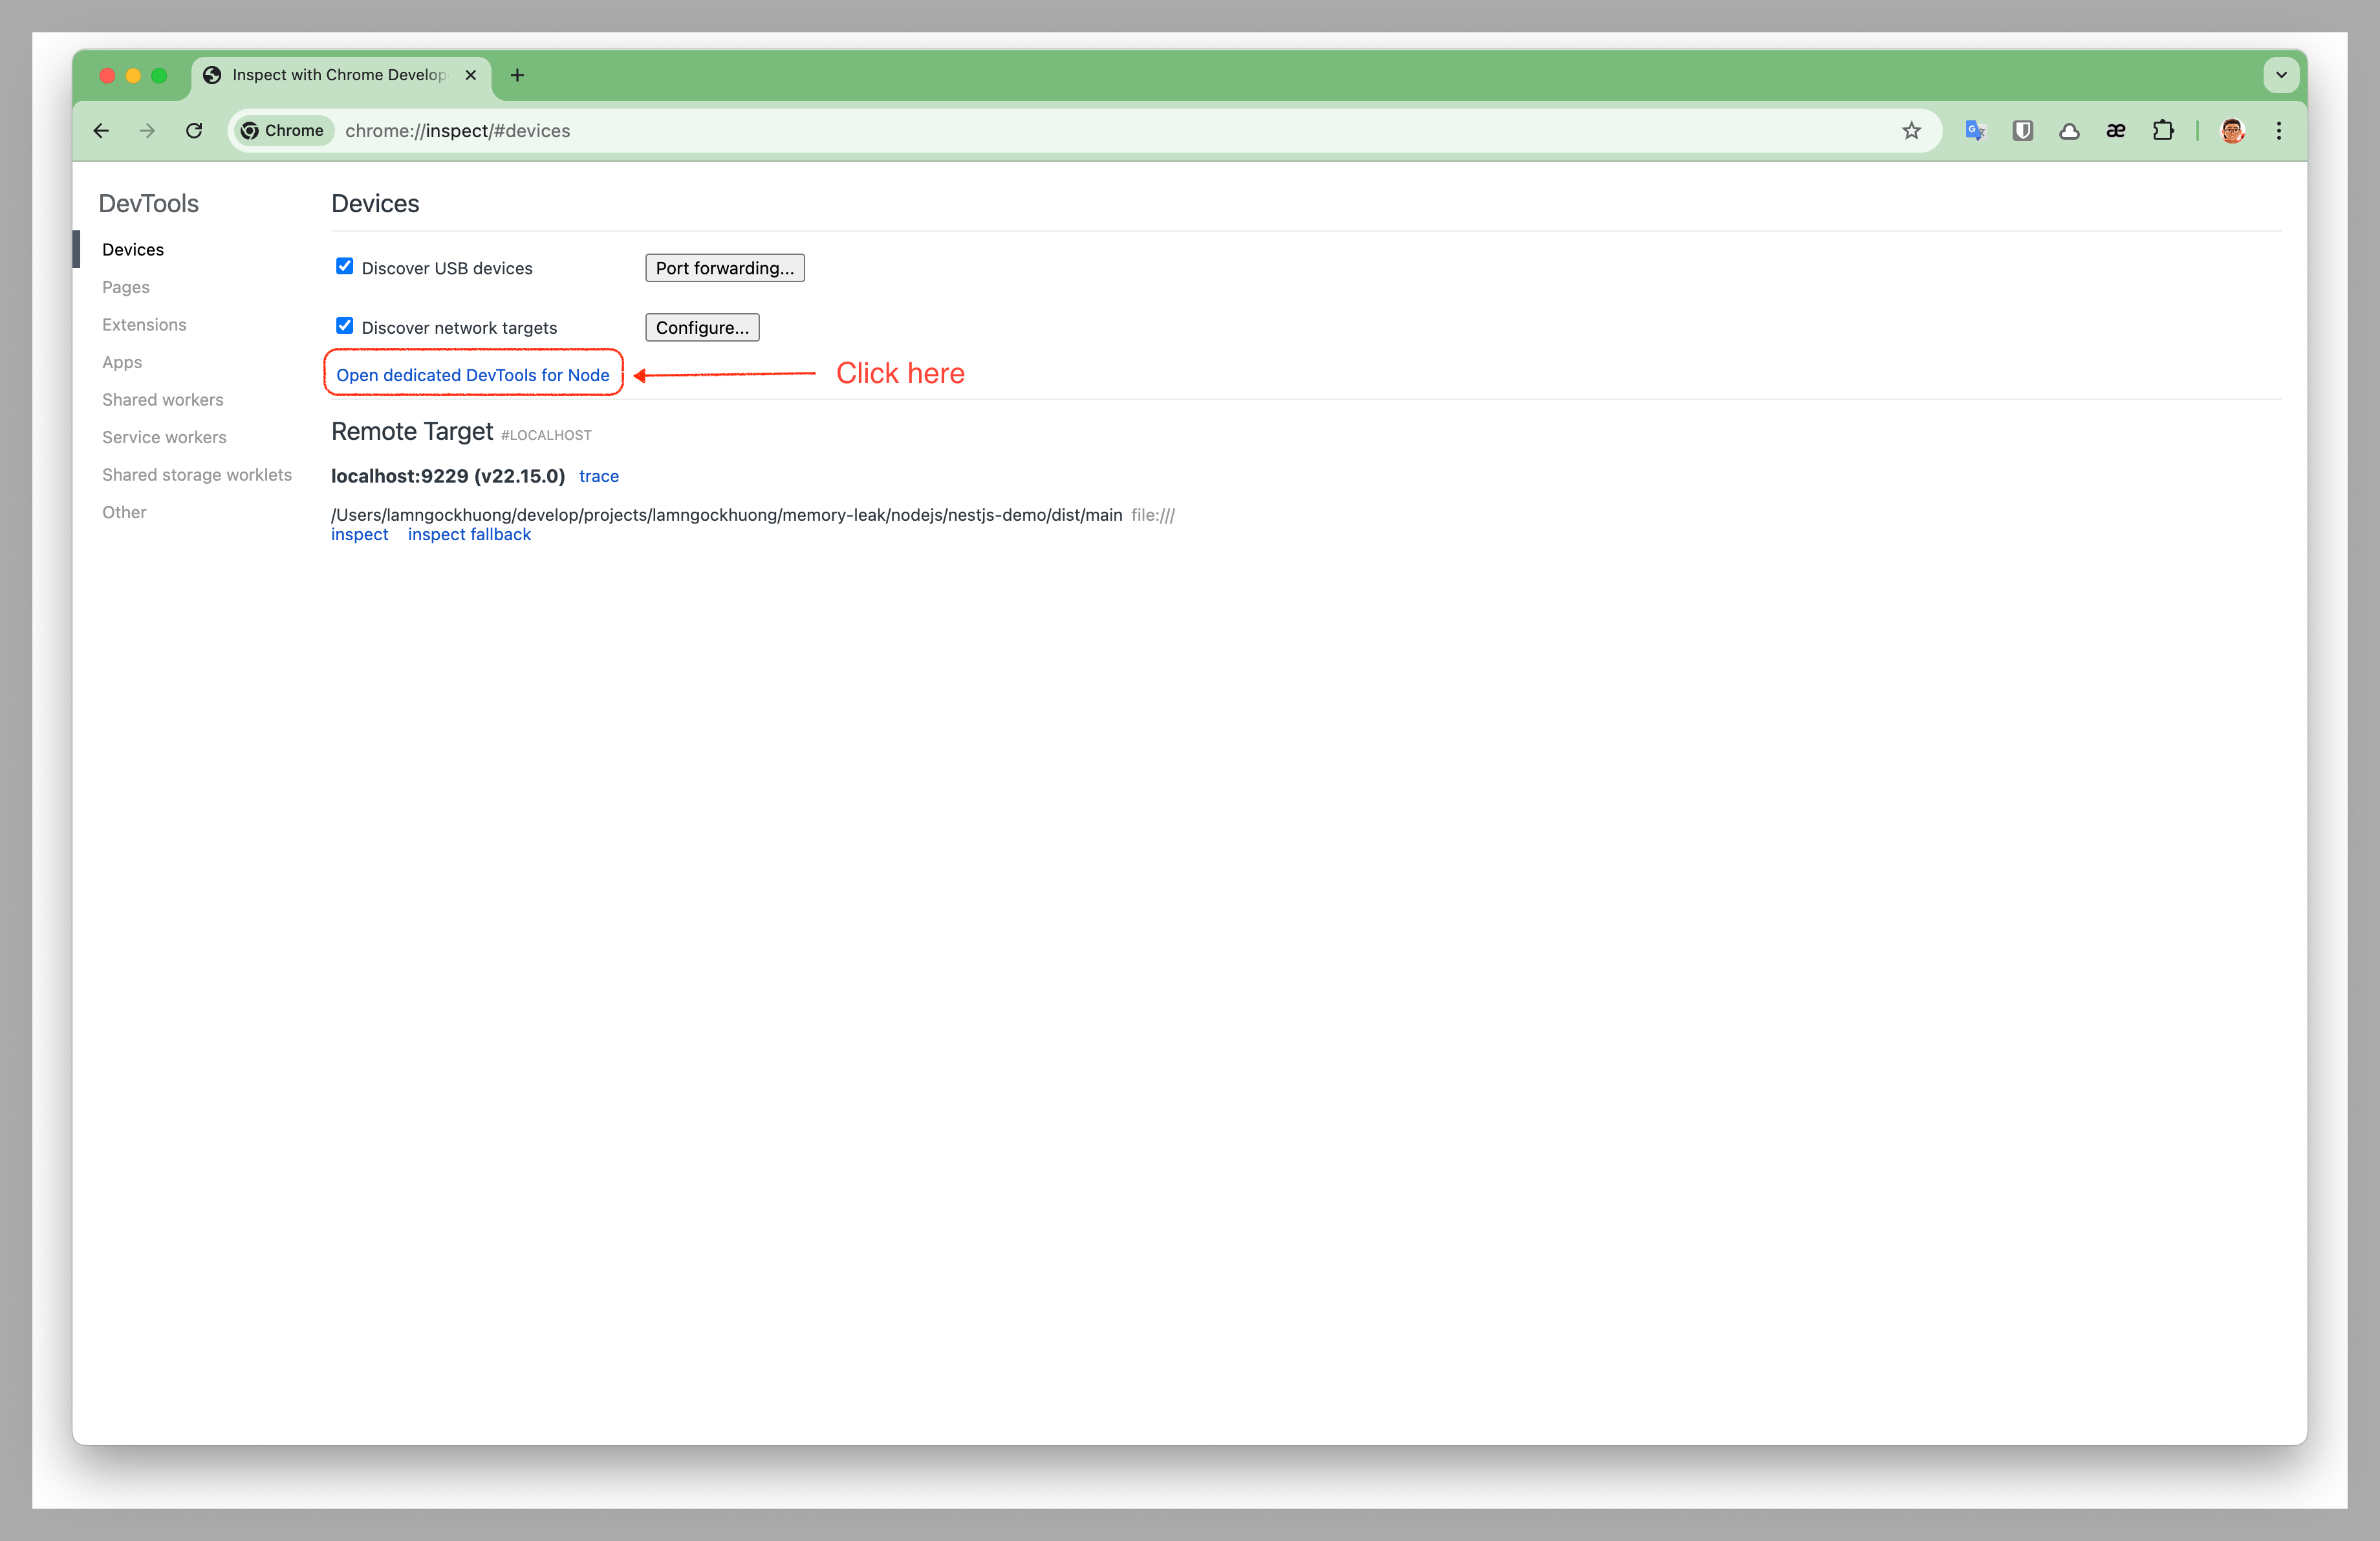 Opening dedicated DevTools for Node.js debugging
Go to "Memory" tab
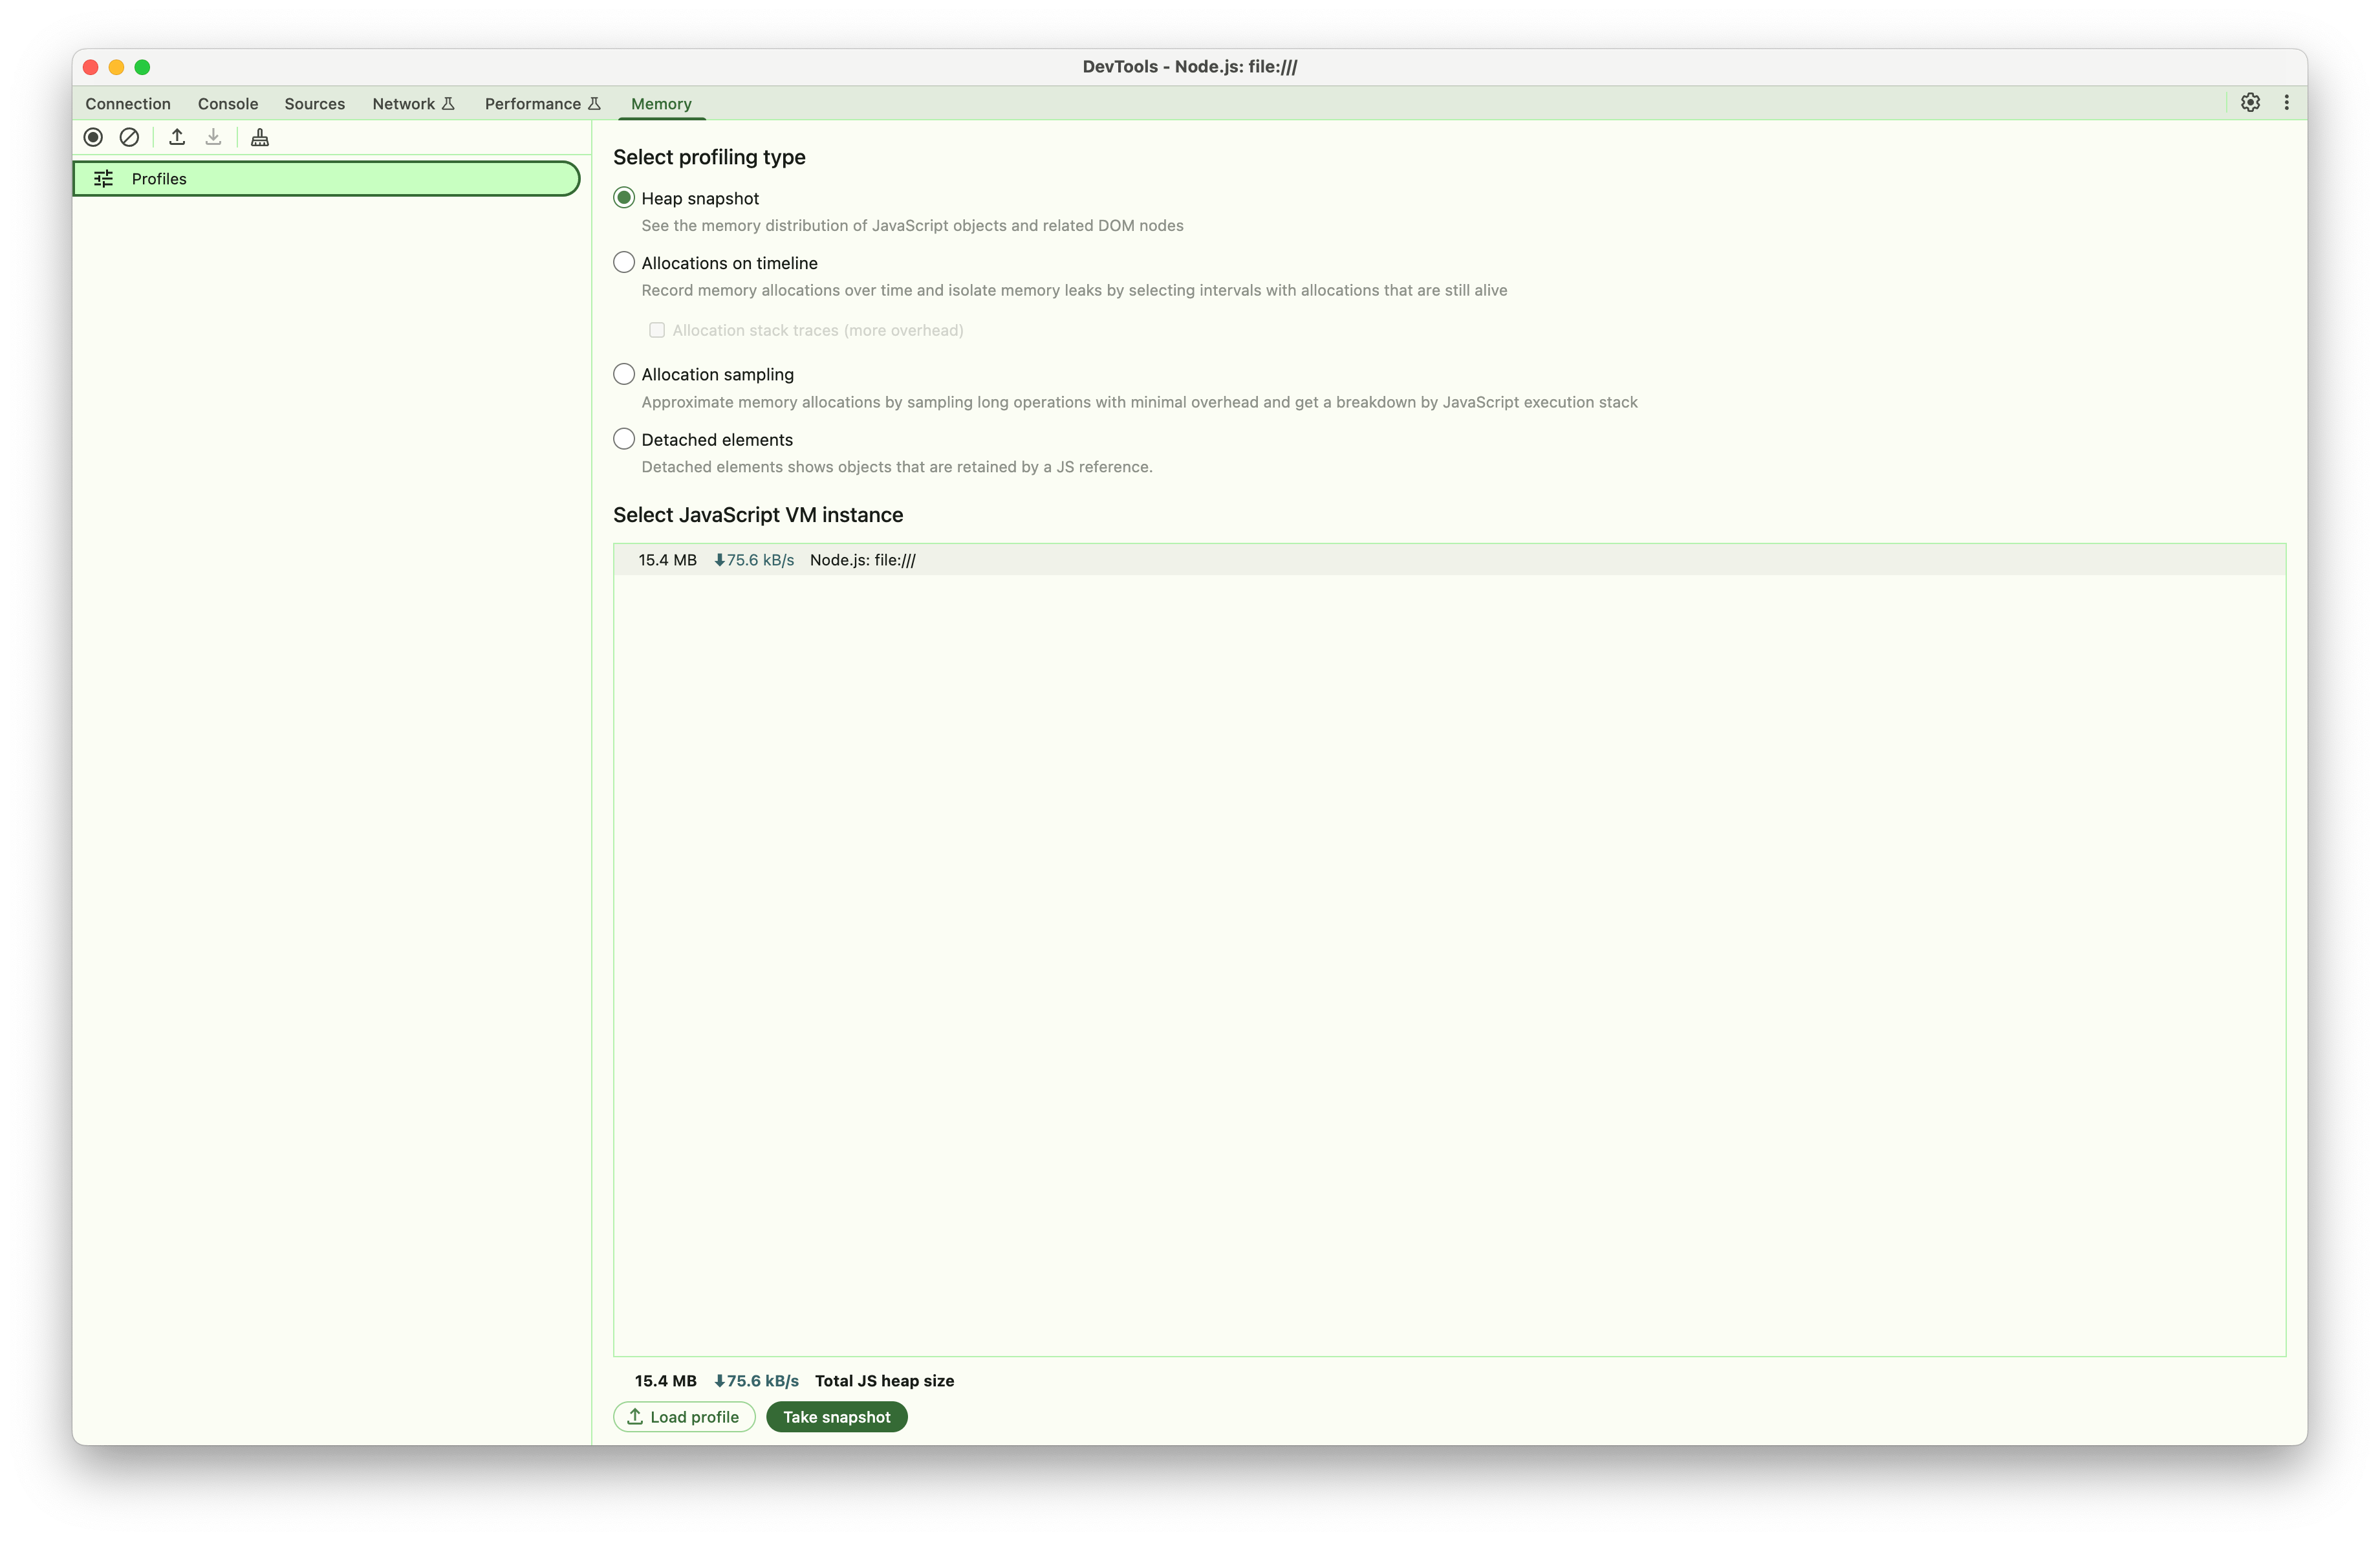 Chrome DevTools Memory tab interface for heap analysis
3. Take Baseline Heap Snapshot
Before triggering any memory leaks:
- Choose "Heap snapshot" and Click "Take snapshot"
- Note the heap size (typically 15-25MB for clean startup)
Pattern-Specific Analysis
Timer Leaks Analysis
Step 1: Trigger Timer Leak
# Start timer leak (call multiple times to create multiple timers)
curl -X POST http://localhost:3000/memory-leak/timer/start
curl -X POST http://localhost:3000/memory-leak/timer/start
curl -X POST http://localhost:3000/memory-leak/timer/start
...

# Check status to see active timer count
curl http://localhost:3000/memory-leak/timer/status
Step 2: Create Multiple Timers
- Call the
/timer/startendpoint multiple times (e.g., 10-20 times) - Each call creates a new timer that runs every second
- Take heap snapshot after creating several timers
- Label it "Timer Leak - Multiple Timers"
Step 3: Analyze in Chrome DevTools
What to Look For:
- Timeout Objects: Filter by "Timeout" in the snapshot
- Memory Growth: Compare heap sizes (baseline vs current)
- Allocation Timeline: Switch to "Allocation instrumentation on timeline"
Key Indicators:
// Objects you'll see in heap dump:
- Timeout objects (count = number of API calls made)
- Timer callback functions (1 per timer)
- Buffer objects (temporary, created every second, then GC'd)
- timers array holding timer references (the actual leak source)
Analysis Steps:
Object Count Comparison:
- Baseline: ~0 Timeout objects
- After 10 API calls: ~10 Timeout objects (1 per API call)
- After 20 API calls: ~20 Timeout objects
Memory Allocation Pattern:
- Each API call creates 1 new timer object
- Each timer allocates 5MB buffer every second (but buffer gets GC'd)
- Timer objects themselves accumulate in memory
- Real leak: Timer objects in
timersarray, not the buffers
Retention Path Analysis:
- Click on Timeout objects
- Follow retention path:
timersarray → Timeout objects → timer callbacks - Each timer runs every 1 second, creating temporary 5MB buffers
Example Analysis Results:
API Calls vs Memory Growth:
├── 10 API calls: 10 timer objects, ~50MB memory (10 × 5MB buffers in flight)
├── 20 API calls: 20 timer objects, ~100MB memory (20 × 5MB buffers in flight)
└── Pattern: Linear growth with number of API calls, not time

Object Analysis:
├── Timeout objects: Equal to number of API calls
├── Buffer allocations: Temporary (get garbage collected)
├── Real leak: Timer object references in array
└── Memory pattern: Spikes every second (buffer alloc/GC cycle)
Cache Leaks Analysis
Step 1: Trigger Cache Leak
# Start cache leak
curl -X POST http://localhost:3000/memory-leak/cache/start

# Add entries to cache (repeat multiple times)
curl -X POST http://localhost:3000/memory-leak/cache/start
curl -X POST http://localhost:3000/memory-leak/cache/start

# Check cache stats
curl http://localhost:3000/memory-leak/cache/stats
Step 2: Heap Dump Analysis
What to Look For:
- Map Objects: Large Map instances in global scope
- Cache Entries: Each entry ~8MB
- Memory Growth Pattern: Linear with cache additions
Key Indicators in DevTools:
// Objects visible in heap dump:
- Map objects with large size
- Cache entry objects
- String keys for cache entries
- Large Buffer/ArrayBuffer objects
Analysis Process:
Find Cache Objects:
- Filter by "Map" or search for cache-related objects
- Look for objects with many retained elements
Measure Cache Impact:
- Each cache entry retains ~8MB
- Count Map entries to estimate total memory
- Check if cache has size limits
Retention Analysis:
- Trace from global variables to cache
- Verify cache cleanup mechanisms
- Check for circular references
Closure Leaks Analysis
Step 1: Trigger Closure Leak
# Start closure leak
curl -X POST http://localhost:3000/memory-leak/closure/start

# Create multiple closures
curl -X POST http://localhost:3000/memory-leak/closure/start
curl -X POST http://localhost:3000/memory-leak/closure/start
Step 2: Analyze Closure Retention
What to Look For:
- Function Objects: Accumulated closure functions
- Scope Objects: Context retained by closures
- Large Buffers: Data captured in closure scope
Analysis Techniques:
Function Object Analysis:
- Filter by "Function" in heap dump
- Look for functions with large retained sizes
- Each closure should retain ~10MB
Scope Chain Analysis:
- Examine function scope properties
- Look for captured variables
- Identify unnecessary data retention
Example Findings:
Closure Analysis Results:
├── Function objects: 3 instances
├── Retained per closure: ~10MB
├── Total memory impact: ~30MB
└── Scope chain: Contains large buffers
Event Listener Leaks Analysis
Step 1: Trigger Event Leak
# Start event listener leak
curl -X POST http://localhost:3000/memory-leak/event/start

# Trigger events to see accumulation
curl -X POST http://localhost:3000/memory-leak/event/trigger
Step 2: Analyze EventEmitter Objects
What to Look For:
- EventEmitter Objects: Check _events property
- Listener Functions: Accumulated event handlers
- Event Data: Large objects retained by listeners
Analysis Steps:
EventEmitter Inspection:
- Find EventEmitter instances
- Check _events property size
- Count listener functions
Listener Retention:
- Each listener retains ~8MB of data
- Verify listener cleanup on component destruction
- Check for listener accumulation patterns
Global Variable Leaks Analysis
Step 1: Trigger Global Leak
# Start global variable leak
curl -X POST http://localhost:3000/memory-leak/global-variable/start
Step 2: Analyze Global Object Growth
What to Look For:
- Global Object Properties: New properties on global scope
- Array Growth: Arrays attached to global that grow over time
- Object References: Objects referenced by global variables
Analysis Process:
Global Scope Inspection:
- Look for global object in heap dump
- Check for custom properties
- Measure array sizes
Reference Tracking:
- Follow references from global to data
- Calculate memory impact per global variable
- Check cleanup mechanisms
Comparative Analysis Techniques
Before/After Comparison
Take Multiple Snapshots:
- Baseline (clean state)
- During leak (active memory consumption)
- After cleanup (post-cleanup state)
Use Comparison View:
- Select two snapshots in DevTools
- Use "Comparison" view to see differences
- Focus on object count changes
Memory Allocation Timeline
Enable Allocation Timeline:
- Switch to "Allocation instrumentation on timeline"
- Start recording before triggering leaks
- Stop recording after leak accumulation
Analyze Allocation Patterns:
- Look for repetitive allocation spikes
- Identify memory allocation sources
- Find objects that aren't being freed
Advanced Analysis Tips
1. Object Grouping
// Group objects by constructor in DevTools:
- Filter by constructor name (e.g., "Timeout", "Map", "Function")
- Sort by retained size to find largest consumers
- Use shallow vs retained size to understand references
2. Retention Path Analysis
// For any large object:
1. Right-click → "Reveal in Summary view"
2. Check "Retainers" section
3. Follow the path from GC roots
4. Identify unexpected retention sources
3. Memory Usage Patterns
// Common patterns to identify:
- Linear growth: Indicates accumulation without cleanup
- Stepped growth: Batch allocations
- Periodic spikes: Regular allocation/deallocation cycles
- Flat line after cleanup: Successful memory recovery
Automated Analysis Scripts
Memory Monitoring Script
// Add to your test suite:
function monitorMemoryGrowth(durationMs = 60000) {
  const initial = process.memoryUsage();

  return new Promise((resolve) => {
    const interval = setInterval(() => {
      const current = process.memoryUsage();
      const growth = {
        rss: current.rss - initial.rss,
        heapUsed: current.heapUsed - initial.heapUsed,
        heapTotal: current.heapTotal - initial.heapTotal
      };

      console.log('Memory Growth:', {
        rss: `${Math.round(growth.rss / 1024 / 1024)}MB`,
        heapUsed: `${Math.round(growth.heapUsed / 1024 / 1024)}MB`
      });
    }, 5000);

    setTimeout(() => {
      clearInterval(interval);
      resolve(process.memoryUsage());
    }, durationMs);
  });
}

// Usage:
await monitorMemoryGrowth(120000); // Monitor for 2 minutes
Best Practices for Heap Analysis
1. Baseline Establishment
- Always take a baseline snapshot before testing
- Restart the application between different leak tests
- Use consistent testing conditions (same load, same time intervals)
2. Progressive Analysis
- Start with small leak durations (30 seconds)
- Gradually increase duration to see growth patterns
- Stop leaks before system resources are exhausted
3. Cleanup Verification
- Take snapshots after stopping leaks
- Verify memory returns to baseline levels
- Check for persistent objects that should have been cleaned
4. Documentation
- Label snapshots clearly with timestamps and actions
- Document the steps taken to reproduce each leak
- Save heap dump files for later comparison
Troubleshooting Common Issues
DevTools Connection Issues
# If Chrome can't connect to Node inspector:
1. Check firewall settings
2. Verify port 9229 is open
3. Try different inspector ports: --inspect=9230
4. Use --inspect-brk to pause on startup
Large Heap Dump Files
# For heap dumps larger than 1GB:
1. Use Chrome Canary (supports larger dumps)
2. Increase Node.js memory limit: --max-old-space-size=8192
3. Take snapshots more frequently to catch growth early
4. Focus on specific object types rather than full dumps
Memory Not Released
# If memory doesn't return to baseline:
1. Force garbage collection: global.gc() (with --expose-gc)
2. Check for global variable pollution
3. Verify all event listeners are removed
4. Look for circular references in heap dump
API Endpoints Reference
Pattern-Specific Endpoints
Each memory leak pattern follows a consistent API structure:
POST /memory-leak/{pattern}/start  # Start the leak
POST /memory-leak/{pattern}/stop   # Stop and cleanup
GET  /memory-leak/{pattern}/status # Get current stats
Where {pattern} can be: timer, cache, closure, event, global-variable
Timer Memory Leaks
POST /memory-leak/timer/start
Starts a new timer-based memory leak.
Response:
{
  "message": "Timer leak started",
  "stats": {
    "activeTimers": 1,
    "memoryAllocated": 0,
    "isLeaking": true
  }
}
GET /memory-leak/timer/status
Check the current status of timer leaks.
Response:
{
  "message": "Timer leak status",
  "stats": {
    "activeTimers": 2,
    "memoryAllocated": 160,
    "isLeaking": true
  }
}
POST /memory-leak/timer/stop
Stop all active timer leaks.
Response:
{
  "message": "Timer leak stopped",
  "stats": {
    "activeTimers": 0,
    "memoryAllocated": 0,
    "isLeaking": false
  }
}
Cache Memory Leaks
POST /memory-leak/cache/start
Starts cache memory leak by adding large objects to cache.
Response:
{
  "message": "Cache leak started",
  "stats": {
    "size": 1,
    "memoryUsage": "8MB",
    "maxSize": 1000
  }
}
GET /memory-leak/cache/stats
Get detailed cache statistics.
Response:
{
  "size": 15,
  "memoryUsage": "120MB",
  "maxSize": 1000,
  "isLeaking": true
}
Closure Memory Leaks
POST /memory-leak/closure/start
Creates closures that capture large data in scope.
Response:
{
  "message": "Closure leak started",
  "stats": {
    "activeFunctions": 1,
    "memoryAllocated": 10,
    "isLeaking": true
  }
}
Event Listener Leaks
POST /memory-leak/event/start
Adds event listeners with large closure data.
Response:
{
  "message": "Event leak started",
  "stats": {
    "activeListeners": 1,
    "totalMemoryAllocated": 8,
    "isLeaking": true
  }
}
POST /memory-leak/event/trigger
Triggers all registered event listeners.
Response:
{
  "message": "Event triggered",
  "listenersNotified": 5
}
Global Variable Leaks
POST /memory-leak/global-variable/start
Creates global variables that accumulate data.
Response:
{
  "message": "Global variable leak started",
  "stats": {
    "globalArrays": 1,
    "totalMemoryUsage": 8,
    "isLeaking": true
  }
}
Overall Status
GET /memory-leak/status
Get overview of all memory leak patterns.
Response:
{
  "timestamp": "2025-09-06T10:30:00.000Z",
  "patterns": {
    "timer": {
      "message": "Timer leak status",
      "stats": {
        "activeTimers": 2,
        "memoryAllocated": 160,
        "isLeaking": true
      }
    },
    "cache": {
      "isLeaking": true,
      "stats": {
        "size": 15,
        "memoryUsage": "120MB",
        "maxSize": 1000
      },
      "message": "Cache status"
    },
    "closure": {
      "activeFunctions": 3,
      "memoryAllocated": 30,
      "isLeaking": true
    },
    "event": {
      "activeListeners": 4,
      "totalMemoryAllocated": 32,
      "isLeaking": true
    },
    "globalVariable": {
      "globalArrays": 2,
      "totalMemoryUsage": 16,
      "isLeaking": true
    }
  },
  "memory": {
    "rss": 245678080,
    "heapUsed": 156432384,
    "heapTotal": 178946048,
    "external": 2841600
  }
}
Debug Endpoints
POST /internal/debug/heapdump
Generate a heap dump for memory analysis.
Headers:
x-admin-token: heapdump_demoResponse:
dump startedNotes:
- Requires admin token for security (configured via
HEAPDUMP_TOKENenvironment variable) - Heap dumps are saved to
./heapdumps/directory - Returns 202 status and processes dump in background
- Use Chrome DevTools or other heap analysis tools to examine
Usage Examples
Testing Timer Leaks with Heap Analysis
# 1. Take baseline heap snapshot in Chrome DevTools

# 2. Start multiple timer leaks (each call creates 1 new timer)
curl -X POST http://localhost:3000/memory-leak/timer/start
curl -X POST http://localhost:3000/memory-leak/timer/start
curl -X POST http://localhost:3000/memory-leak/timer/start
curl -X POST http://localhost:3000/memory-leak/timer/start
curl -X POST http://localhost:3000/memory-leak/timer/start

# 3. Check status to see active timer count
curl http://localhost:3000/memory-leak/timer/status

# 4. Take heap snapshot after creating timers

# 5. Optionally create more timers and compare snapshots
curl -X POST http://localhost:3000/memory-leak/timer/start
curl -X POST http://localhost:3000/memory-leak/timer/start

# 6. Stop the leak
curl -X POST http://localhost:3000/memory-leak/timer/stop

# 7. Take final heap snapshot to verify cleanup
Expected Behavior:
- Memory Growth: ~5MB allocated per second per active timer (buffers get GC'd)
- Heap Objects: Timeout object count = number of API calls made
- Real Leak: Timer objects held in array, not the temporary buffers
- Cleanup: Timer count returns to 0, memory stabilizes after stopping
Testing Multiple Patterns Simultaneously
# Start multiple different leaks
curl -X POST http://localhost:3000/memory-leak/timer/start
curl -X POST http://localhost:3000/memory-leak/cache/start
curl -X POST http://localhost:3000/memory-leak/event/start

# Check overall status
curl http://localhost:3000/memory-leak/status

# Monitor for 3 minutes with heap snapshots

# Stop all leaks
curl -X POST http://localhost:3000/memory-leak/timer/stop
curl -X POST http://localhost:3000/memory-leak/cache/stop
curl -X POST http://localhost:3000/memory-leak/event/stop
Cache Leak Analysis Workflow
# 1. Baseline snapshot

# 2. Start cache leak and add entries
curl -X POST http://localhost:3000/memory-leak/cache/start
curl -X POST http://localhost:3000/memory-leak/cache/start
curl -X POST http://localhost:3000/memory-leak/cache/start

# 3. Check cache stats
curl http://localhost:3000/memory-leak/cache/stats

# 4. Take heap snapshot - look for Map objects

# 5. Add more entries
for i in {1..10}; do
  curl -X POST http://localhost:3000/memory-leak/cache/start
done

# 6. Final snapshot and comparison
curl http://localhost:3000/memory-leak/cache/stats
Generating Heap Dumps for Analysis
# Method 1: API endpoint (requires token)
curl -X POST \
  -H "x-admin-token: heapdump_demo" \
  http://localhost:3000/internal/debug/heapdump

# Method 2: Signal-based (macOS/Linux)
# Find Node.js process ID
ps aux | grep node | grep nestjs-demo

# Send USR2 signal to generate heap dump
kill -USR2 <process_id>

# Method 3: Programmatic via Chrome DevTools
# Use Chrome DevTools Memory tab -> Take heap snapshot
Memory Monitoring and Analysis
Real-time Memory Monitoring
Command Line Monitoring
# Monitor Node.js process memory usage
watch -n 1 'ps aux | grep node | grep nestjs | grep -v grep'

# Monitor system memory
watch -n 1 'free -h'

# Use htop for interactive monitoring
htop -p $(pgrep -f nestjs-demo)
Application-Level Monitoring
// Add this to monitor memory in your application
setInterval(() => {
  const usage = process.memoryUsage();
  console.log('Memory Usage:', {
    rss: `${Math.round(usage.rss / 1024 / 1024)} MB`,
    heapUsed: `${Math.round(usage.heapUsed / 1024 / 1024)} MB`,
    heapTotal: `${Math.round(usage.heapTotal / 1024 / 1024)} MB`,
    external: `${Math.round(usage.external / 1024 / 1024)} MB`
  });
}, 5000);
Expected Memory Patterns
Timer Leaks
- Growth Rate: ~8MB per second per active timer
- Pattern: Linear increase while timer is running
- Cleanup: Immediate memory stabilization when stopped
- Heap Objects: Timeout objects accumulate, released on cleanup
Cache Leaks
- Growth Rate: ~8MB per cache entry
- Pattern: Stepped increases with each cache addition
- Cleanup: Memory released when cache is cleared
- Heap Objects: Map objects with large retained sizes
Closure Leaks
- Growth Rate: ~10MB per closure function
- Pattern: Incremental growth with each closure creation
- Cleanup: Functions and scope data released when cleared
- Heap Objects: Function objects with large retained contexts
Event Listener Leaks
- Growth Rate: ~8MB per event listener
- Pattern: Stepped growth with listener registration
- Cleanup: Listeners and associated data released on cleanup
- Heap Objects: EventEmitter with accumulated _events
Global Variable Leaks
- Growth Rate: ~8MB per global array/object
- Pattern: Permanent growth until explicit cleanup
- Cleanup: Requires explicit global property deletion
- Heap Objects: Large arrays/objects attached to global scope
Integration with Testing
Automated Memory Testing
// Example Jest test for memory leak detection
describe('Memory Leak Detection', () => {
  it('should not leak memory with timer operations', async () => {
    const initialMemory = process.memoryUsage().heapUsed;

    // Start timer leak
    await request(app)
      .post('/memory-leak/timer/start')
      .expect(201);

    // Wait for memory accumulation
    await new Promise(resolve => setTimeout(resolve, 5000));

    const duringLeakMemory = process.memoryUsage().heapUsed;
    expect(duringLeakMemory).toBeGreaterThan(initialMemory + 5 * 1024 * 1024); // 5MB growth

    // Stop leak
    await request(app)
      .post('/memory-leak/timer/stop')
      .expect(201);

    // Allow cleanup
    await new Promise(resolve => setTimeout(resolve, 2000));
    global.gc && global.gc(); // Force GC if available

    const finalMemory = process.memoryUsage().heapUsed;
    expect(finalMemory).toBeLessThan(duringLeakMemory); // Memory should decrease
  });
});
Security and Safety Notes
Production Considerations
- Never deploy this demo application to production environments
- Remove debug endpoints in production builds
- Secure admin tokens - change default
HEAPDUMP_TOKENvalue - Monitor resource usage to prevent system exhaustion
Safe Testing Practices
- Test in isolation - use dedicated development/testing environments
- Set time limits - don't run leaks indefinitely
- Monitor system resources - stop tests if memory usage becomes critical
- Clean up after tests - always stop active leaks when finished
Resource Limits
# Set Node.js memory limits for testing
node --max-old-space-size=4096 dist/main.js  # 4GB limit

# Monitor memory usage during tests
while true; do
  memory=$(ps -o pid,vsz,rss,comm -p $(pgrep -f nestjs-demo) | tail -1 | awk '{print $3}')
  if [ "$memory" -gt 2000000 ]; then  # 2GB in KB
    echo "Memory usage critical: ${memory}KB"
    break
  fi
  sleep 5
done
Troubleshooting
Common Issues
Port Already in Use
# Find and kill processes using port 3000
lsof -ti:3000 | xargs kill -9

# Or use a different port
PORT=3001 npm run start:dev
Application Becomes Unresponsive
# Force stop all leaks via API
curl -X POST http://localhost:3000/memory-leak/timer/stop
curl -X POST http://localhost:3000/memory-leak/cache/stop
curl -X POST http://localhost:3000/memory-leak/closure/stop
curl -X POST http://localhost:3000/memory-leak/event/stop
curl -X POST http://localhost:3000/memory-leak/global-variable/stop

# If API is unresponsive, restart the process
pkill -f nestjs-demo
Heap Dump Generation Fails
# Ensure sufficient disk space for heap dumps
df -h ./heapdumps/

# Check write permissions
ls -la ./heapdumps/

# Verify admin token
export HEAPDUMP_TOKEN=heapdump_demo
Chrome DevTools Connection Issues
# Start with specific inspector configuration
node --inspect=0.0.0.0:9229 --inspect-brk dist/main.js

# Try different ports if 9229 is occupied
node --inspect=0.0.0.0:9230 dist/main.js

# Check firewall settings for inspector port
Memory Analysis Troubleshooting
Large Heap Dumps
- Use Chrome Canary for large heap dump support
- Increase Node.js memory limits:
--max-old-space-size=8192 - Take snapshots more frequently to catch growth early
- Focus analysis on specific object types
Unexpected Memory Retention
- Check for global variable pollution
- Verify all event listeners are properly removed
- Look for circular references in heap dumps
- Force garbage collection with
global.gc()(requires--expose-gc)
Analysis Performance Issues
- Filter heap dumps by object type
- Use comparison view instead of full analysis
- Focus on objects with large retained sizes
- Take smaller, targeted snapshots
Additional Resources
V8 Heap Dump Analysis Tools
- Chrome DevTools: Built-in memory profiling
- heapdump npm package: Programmatic heap dump generation
- clinic.js: Comprehensive Node.js performance analysis
- 0x: Flame graph generation for CPU profiling