Demo Memory Leak NestJS
Tài liệu này mô tả ứng dụng demo NestJS để kiểm tra và minh họa các loại memory leak khác nhau trong môi trường Node.js/TypeScript.
Tổng quan
Demo NestJS cung cấp các API endpoint tương tác để mô phỏng các pattern memory leak phổ biến trong ứng dụng Node.js. Phương pháp thực hành này giúp các nhà phát triển hiểu cách memory leak biểu hiện và cách phát hiện chúng bằng phân tích V8 heap dump.
Bắt đầu
Yêu cầu hệ thống
- Node.js 22+
- pnpm
- Hiểu biết cơ bản về REST APIs
Cài đặt
cd nodejs/nestjs-demo
pnpm install
pnpm run start:dev
📖 Thiết lập nhanh: Để thiết lập nhanh và tham khảo API, xem README.md của dự án
🎯 Hướng dẫn này: Tập trung vào nội dung giáo dục và phân tích heap dump toàn diện
Base URL
http://localhost:3000Các Pattern Memory Leak có sẵn
Demo hỗ trợ 5 pattern memory leak khác nhau:
1. Timer Leaks
- Pattern: Các đối tượng setTimeout/setInterval không được dọn dẹp
- API:
/memory-leak/timer/* - Tác động bộ nhớ: Các đối tượng timer tích lũy trong bộ nhớ
2. Cache Leaks
- Pattern: Cache tăng trưởng không giới hạn mà không có cơ chế eviction
- API:
/memory-leak/cache/* - Tác động bộ nhớ: ~8MB mỗi cache entry
3. Closure Leaks
- Pattern: Các function giữ dữ liệu lớn trong scope
- API:
/memory-leak/closure/* - Tác động bộ nhớ: 10MB mỗi closure function
4. Event Listener Leaks
- Pattern: EventEmitter listener không bao giờ được remove
- API:
/memory-leak/event/* - Tác động bộ nhớ: 8MB mỗi listener
5. Global Variable Leaks
- Pattern: Các đối tượng global tăng trưởng vô hạn
- API:
/memory-leak/global-variable/* - Tác động bộ nhớ: ~8MB mỗi global array
Health Check
GET /health/ready
Kiểm tra xem ứng dụng đã sẵn sàng nhận request chưa.
Response:
{
  "status": "ok"
}
🔍 Phân tích V8 Heap Dump
Phần này cung cấp hướng dẫn chi tiết về việc phân tích memory leak bằng V8 heap dumps và Chrome DevTools.
Yêu cầu cho việc phân tích
- Trình duyệt Chrome (cho DevTools)
- Node.js với flag
--inspectđược bật - Hiểu biết cơ bản về JavaScript objects và references
Thiết lập cho phân tích Heap Dump
1. Khởi động ứng dụng với Inspector
# Khởi động NestJS demo với inspector được bật
cd nodejs/nestjs-demo
node --inspect=0.0.0.0:9229 dist/main.js

# Hoặc trong development mode
pnpm run start:debug
2. Kết nối Chrome DevTools
Mở trình duyệt Chrome
Điều hướng đến
chrome://inspectClick "Open dedicated DevTools for Node"
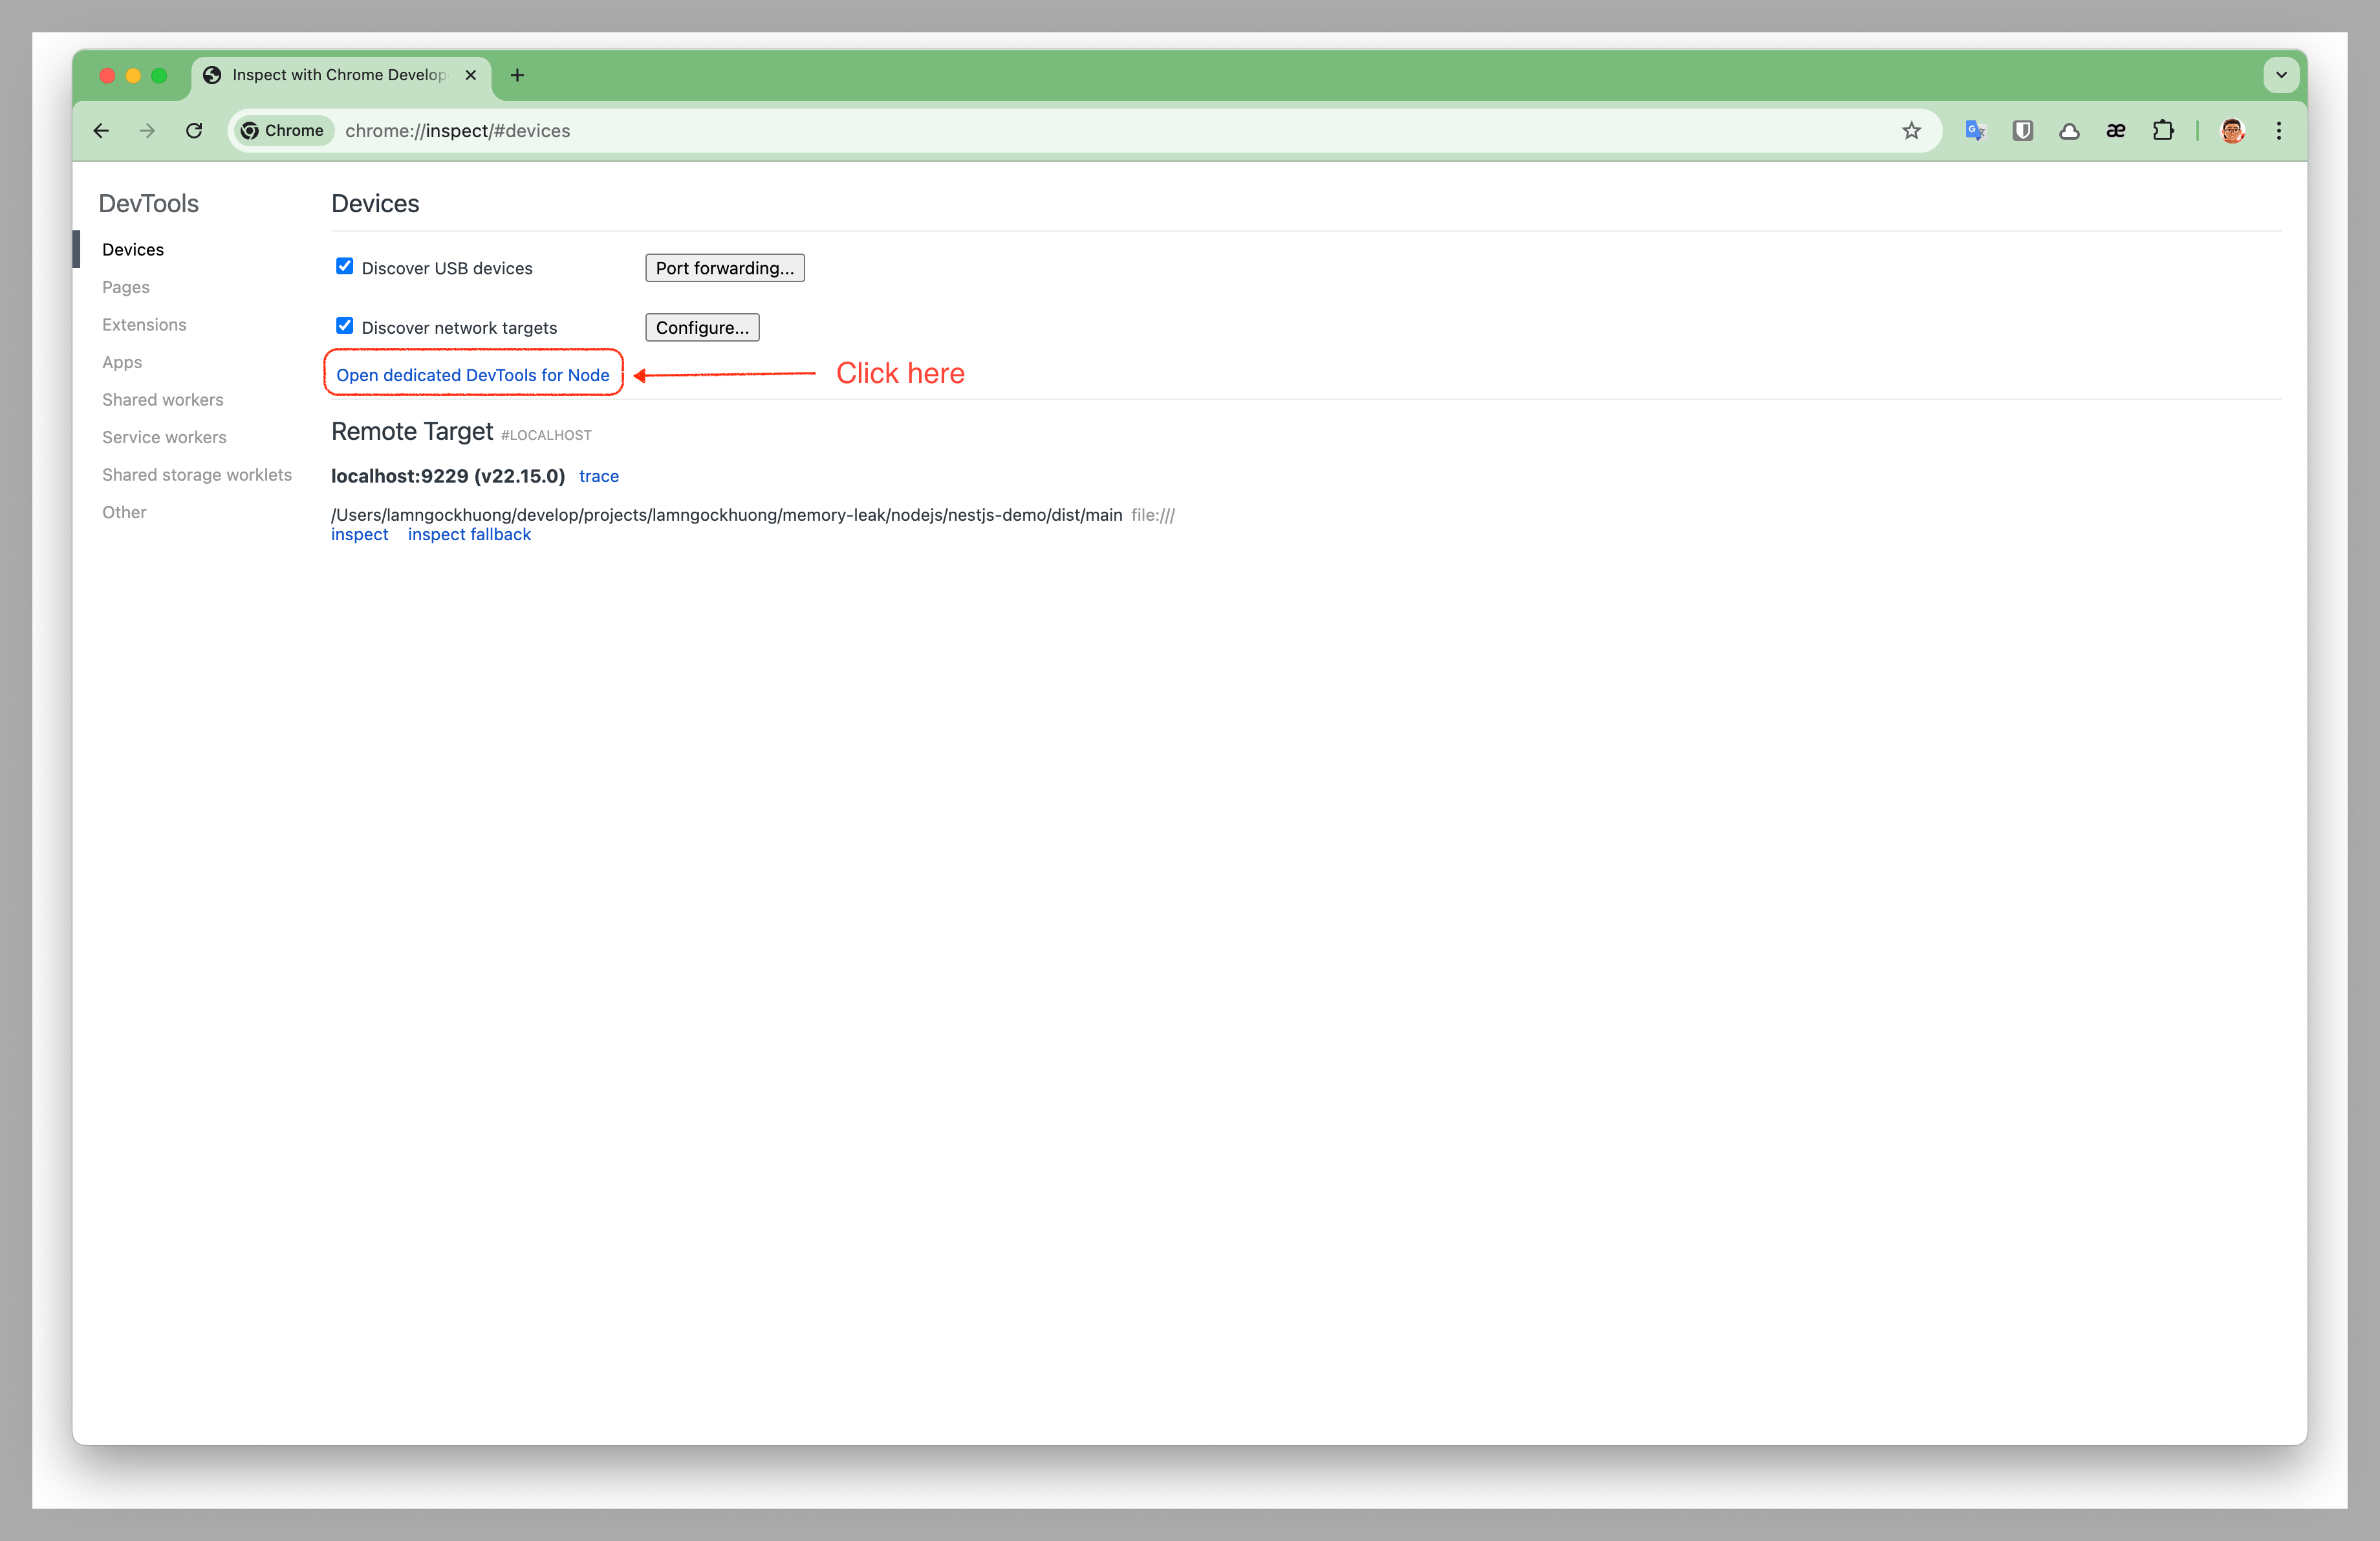 Mở DevTools chuyên dụng cho Node.js debugging
Đi đến tab "Memory"
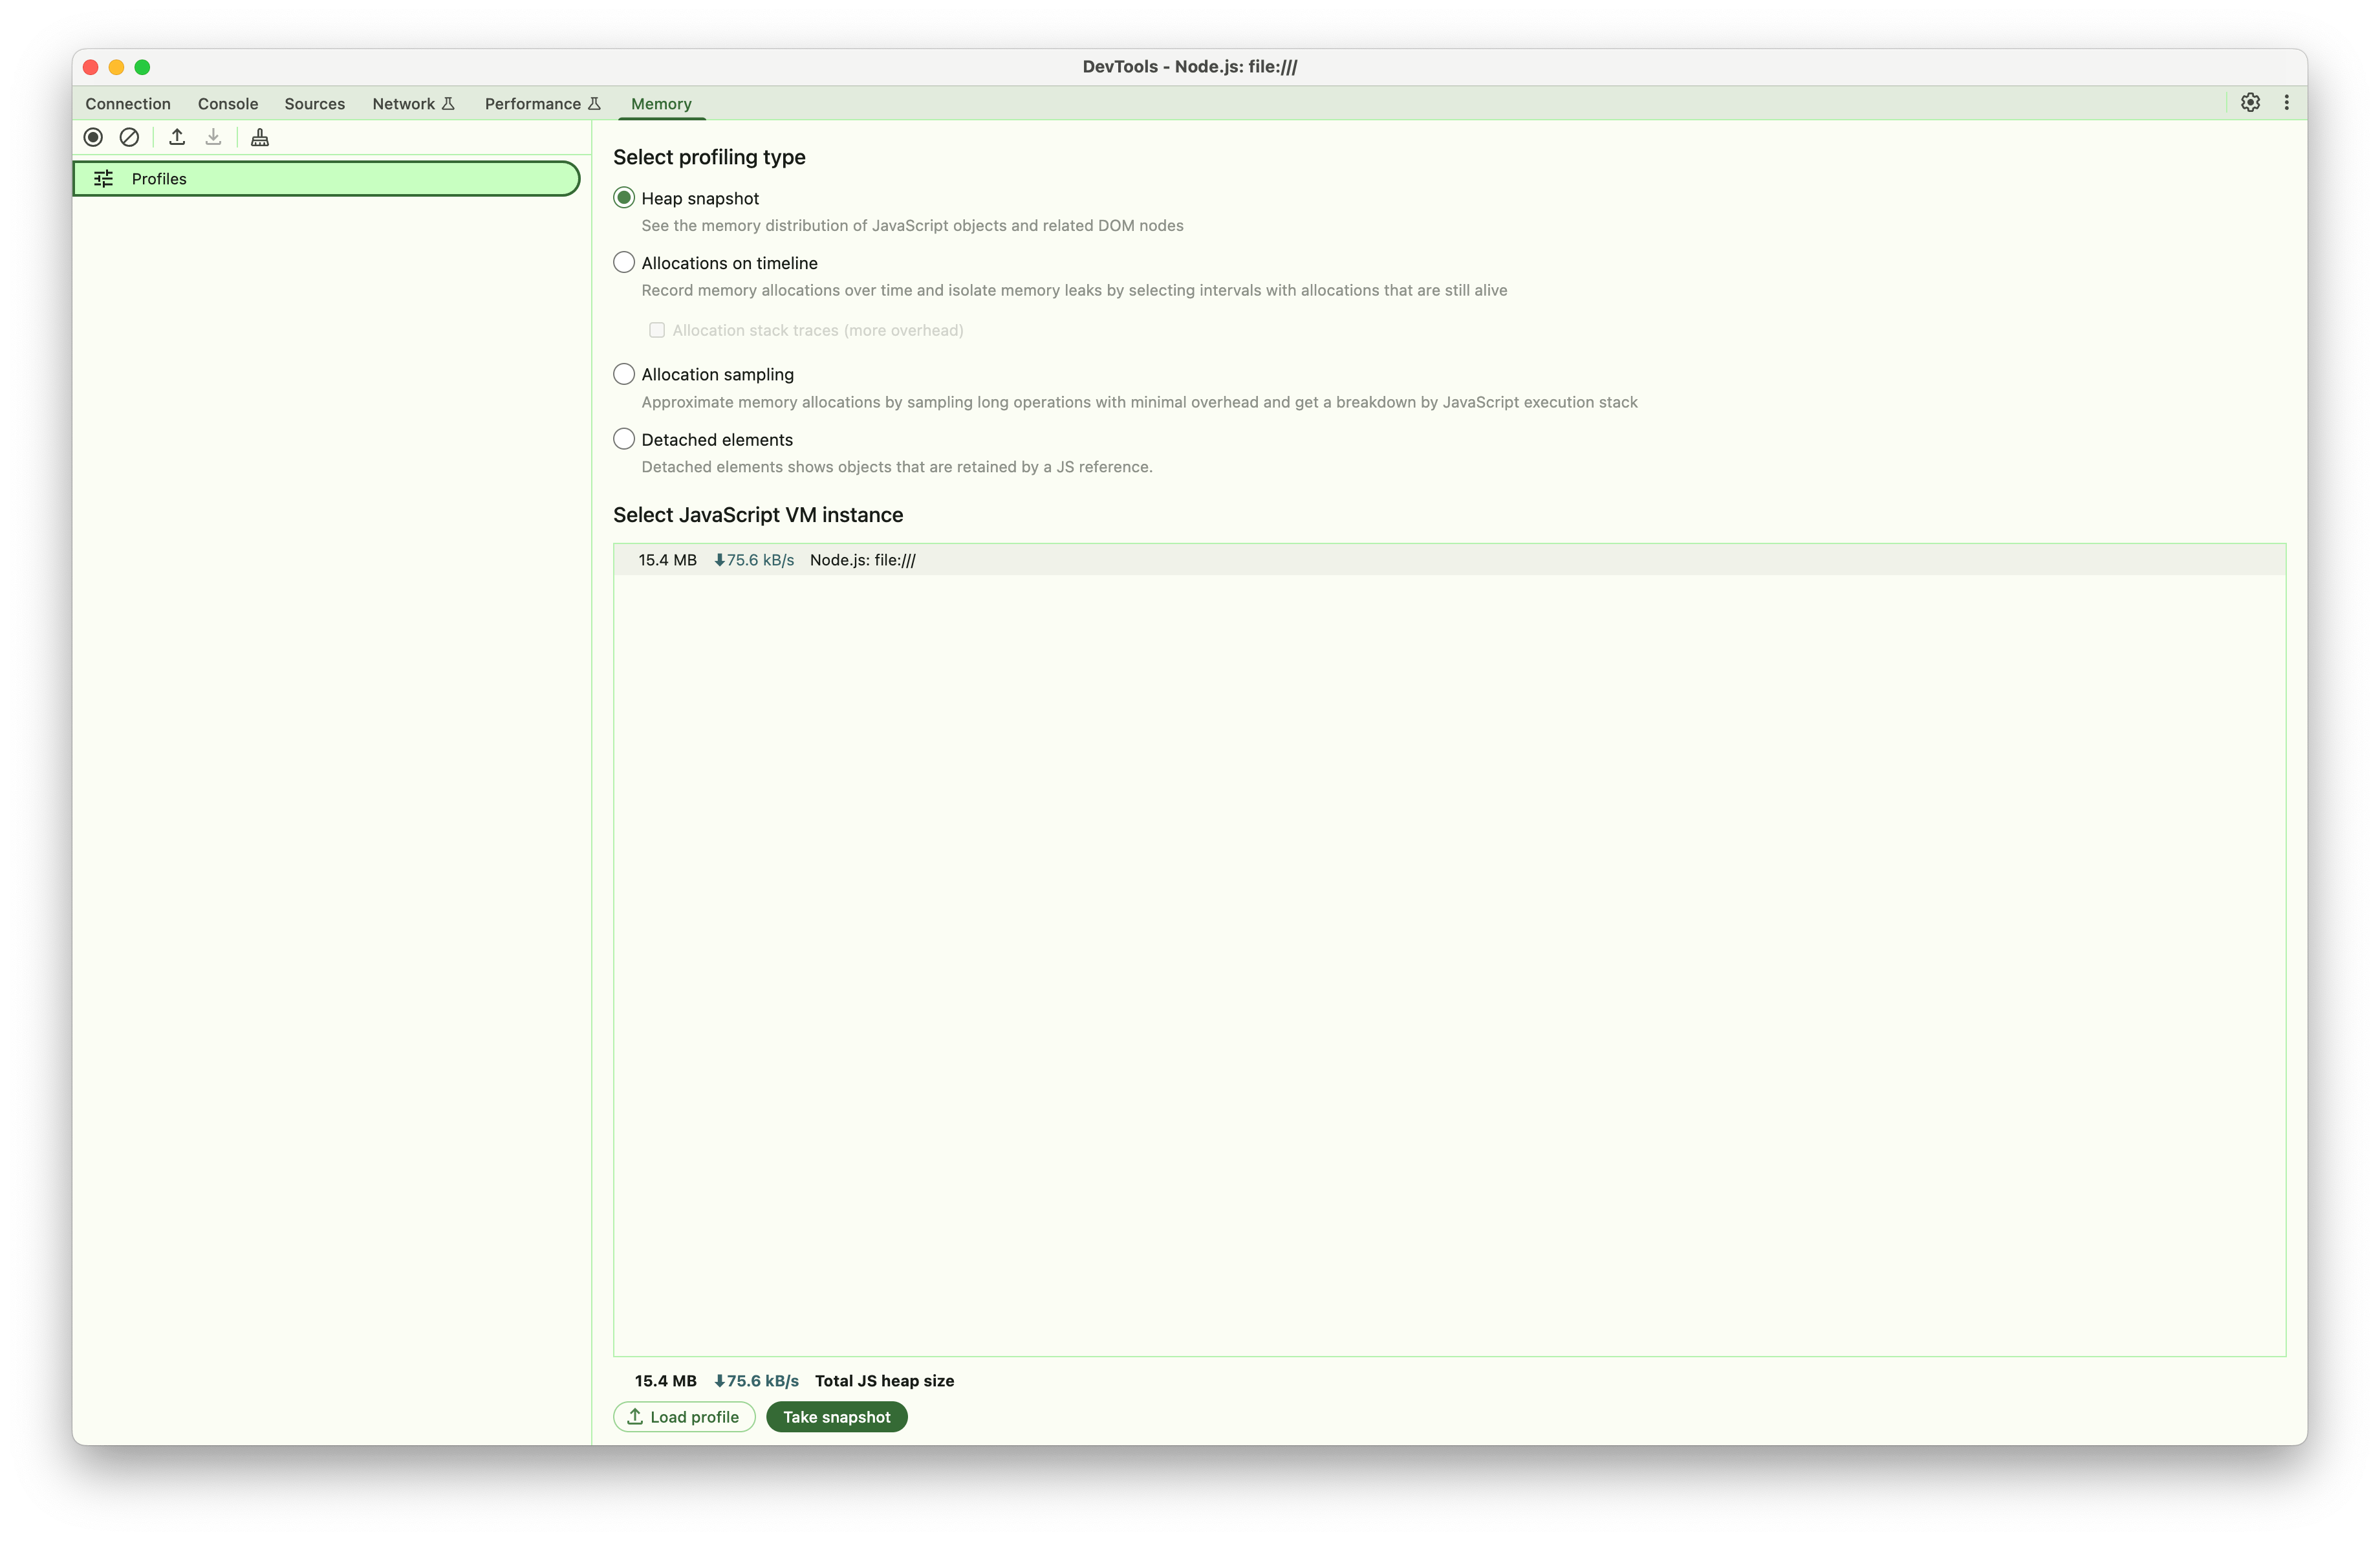 Giao diện tab Memory của Chrome DevTools để phân tích heap
3. Tạo Baseline Heap Snapshot
Trước khi kích hoạt bất kỳ memory leak nào:
- Chọn "Heap snapshot" và Click "Take snapshot"
- Lưu ý kích thước heap (thường là 15-25MB cho clean startup)
Phân tích theo từng Pattern
Phân tích Timer Leaks
Bước 1: Kích hoạt Timer Leak
# Bắt đầu timer leak (gọi nhiều lần để tạo nhiều timers)
curl -X POST http://localhost:3000/memory-leak/timer/start
curl -X POST http://localhost:3000/memory-leak/timer/start
curl -X POST http://localhost:3000/memory-leak/timer/start
...

# Kiểm tra trạng thái để xem số lượng active timers
curl http://localhost:3000/memory-leak/timer/status
Bước 2: Tạo nhiều Timers
- Gọi endpoint
/timer/startnhiều lần (ví dụ: 10-20 lần) - Mỗi lần gọi tạo một timer mới chạy mỗi giây
- Tạo heap snapshot sau khi tạo nhiều timers
- Đặt label "Timer Leak - Multiple Timers"
Bước 3: Phân tích trong Chrome DevTools
Cần tìm kiếm:
- Timeout Objects: Lọc theo "Timeout" trong snapshot
- Memory Growth: So sánh kích thước heap (baseline vs hiện tại)
- Allocation Timeline: Chuyển sang "Allocation instrumentation on timeline"
Chỉ số quan trọng:
// Các object bạn sẽ thấy trong heap dump:
- Timeout objects (số lượng = số lần gọi API)
- Timer callback functions (1 per timer)
- Buffer objects (tạm thời, tạo mỗi giây, sau đó GC)
- timers array giữ timer references (nguồn leak thực sự)
Các bước phân tích:
So sánh số lượng Object:
- Baseline: ~0 Timeout objects
- Sau 10 lần gọi API: ~10 Timeout objects (1 per API call)
- Sau 20 lần gọi API: ~20 Timeout objects
Pattern Memory Allocation:
- Mỗi lần gọi API tạo 1 timer object mới
- Mỗi timer allocate 5MB buffer mỗi giây (nhưng buffer được GC)
- Timer objects tích lũy trong memory
- Leak thực sự: Timer objects trong array
timers, không phải buffers
Phân tích Retention Path:
- Click vào Timeout objects
- Theo retention path: array
timers→ Timeout objects → timer callbacks - Mỗi timer chạy mỗi 1 giây, tạo buffer 5MB tạm thời
Ví dụ kết quả phân tích:
API Calls vs Memory Growth:
├── 10 lần gọi API: 10 timer objects, ~50MB memory (10 × 5MB buffers đang chạy)
├── 20 lần gọi API: 20 timer objects, ~100MB memory (20 × 5MB buffers đang chạy)
└── Pattern: Tăng trưởng tuyến tính theo số lần gọi API, không phải thời gian

Phân tích Object:
├── Timeout objects: Bằng số lần gọi API
├── Buffer allocations: Tạm thời (được garbage collected)
├── Leak thực sự: Timer object references trong array
└── Memory pattern: Tăng đột biến mỗi giây (buffer alloc/GC cycle)
Phân tích Cache Leaks
Bước 1: Kích hoạt Cache Leak
# Bắt đầu cache leak
curl -X POST http://localhost:3000/memory-leak/cache/start

# Thêm entries vào cache (lặp lại nhiều lần)
curl -X POST http://localhost:3000/memory-leak/cache/start
curl -X POST http://localhost:3000/memory-leak/cache/start

# Kiểm tra cache stats
curl http://localhost:3000/memory-leak/cache/stats
Bước 2: Phân tích Heap Dump
Cần tìm kiếm:
- Map Objects: Các Map instance lớn trong global scope
- Cache Entries: Mỗi entry ~8MB
- Memory Growth Pattern: Tuyến tính với cache additions
Chỉ số quan trọng trong DevTools:
// Objects hiển thị trong heap dump:
- Map objects với size lớn
- Cache entry objects
- String keys cho cache entries
- Large Buffer/ArrayBuffer objects
Quy trình phân tích:
Tìm Cache Objects:
- Lọc theo "Map" hoặc tìm cache-related objects
- Tìm objects với nhiều retained elements
Đo lường Cache Impact:
- Mỗi cache entry retain ~8MB
- Đếm Map entries để ước tính tổng memory
- Kiểm tra xem cache có size limits không
Phân tích Retention:
- Trace từ global variables đến cache
- Xác minh cache cleanup mechanisms
- Kiểm tra circular references
Phân tích Closure Leaks
Bước 1: Kích hoạt Closure Leak
# Bắt đầu closure leak
curl -X POST http://localhost:3000/memory-leak/closure/start

# Tạo nhiều closures
curl -X POST http://localhost:3000/memory-leak/closure/start
curl -X POST http://localhost:3000/memory-leak/closure/start
Bước 2: Phân tích Closure Retention
Cần tìm kiếm:
- Function Objects: Các closure function tích lũy
- Scope Objects: Context được retain bởi closures
- Large Buffers: Data được capture trong closure scope
Kỹ thuật phân tích:
Phân tích Function Object:
- Lọc theo "Function" trong heap dump
- Tìm functions với retained sizes lớn
- Mỗi closure nên retain ~10MB
Phân tích Scope Chain:
- Kiểm tra function scope properties
- Tìm captured variables
- Xác định unnecessary data retention
Ví dụ kết quả:
Kết quả phân tích Closure:
├── Function objects: 3 instances
├── Retained per closure: ~10MB
├── Tổng memory impact: ~30MB
└── Scope chain: Chứa large buffers
Phân tích Event Listener Leaks
Bước 1: Kích hoạt Event Leak
# Bắt đầu event listener leak
curl -X POST http://localhost:3000/memory-leak/event/start

# Trigger events để xem accumulation
curl -X POST http://localhost:3000/memory-leak/event/trigger
Bước 2: Phân tích EventEmitter Objects
Cần tìm kiếm:
- EventEmitter Objects: Kiểm tra _events property
- Listener Functions: Các event handler tích lũy
- Event Data: Large objects được retain bởi listeners
Các bước phân tích:
EventEmitter Inspection:
- Tìm EventEmitter instances
- Kiểm tra _events property size
- Đếm listener functions
Listener Retention:
- Mỗi listener retain ~8MB data
- Xác minh listener cleanup khi component destruction
- Kiểm tra listener accumulation patterns
Phân tích Global Variable Leaks
Bước 1: Kích hoạt Global Leak
# Bắt đầu global variable leak
curl -X POST http://localhost:3000/memory-leak/global-variable/start
Bước 2: Phân tích Global Object Growth
Cần tìm kiếm:
- Global Object Properties: Properties mới trên global scope
- Array Growth: Arrays được attach vào global tăng trưởng theo thời gian
- Object References: Objects được reference bởi global variables
Quy trình phân tích:
Global Scope Inspection:
- Tìm global object trong heap dump
- Kiểm tra custom properties
- Đo lường array sizes
Reference Tracking:
- Theo references từ global đến data
- Tính memory impact per global variable
- Kiểm tra cleanup mechanisms
Kỹ thuật phân tích so sánh
So sánh Before/After
Tạo nhiều Snapshots:
- Baseline (clean state)
- During leak (active memory consumption)
- After cleanup (post-cleanup state)
Sử dụng Comparison View:
- Chọn hai snapshots trong DevTools
- Sử dụng "Comparison" view để xem differences
- Tập trung vào object count changes
Memory Allocation Timeline
Bật Allocation Timeline:
- Chuyển sang "Allocation instrumentation on timeline"
- Bắt đầu recording trước khi trigger leaks
- Dừng recording sau leak accumulation
Phân tích Allocation Patterns:
- Tìm repetitive allocation spikes
- Xác định memory allocation sources
- Tìm objects không được freed
Mẹo phân tích nâng cao
1. Object Grouping
// Group objects theo constructor trong DevTools:
- Lọc theo constructor name (ví dụ: "Timeout", "Map", "Function")
- Sắp xếp theo retained size để tìm largest consumers
- Sử dụng shallow vs retained size để hiểu references
2. Retention Path Analysis
// Cho bất kỳ large object nào:
1. Right-click → "Reveal in Summary view"
2. Kiểm tra "Retainers" section
3. Theo path từ GC roots
4. Xác định unexpected retention sources
3. Memory Usage Patterns
// Các pattern phổ biến cần xác định:
- Linear growth: Chỉ ra accumulation mà không có cleanup
- Stepped growth: Batch allocations
- Periodic spikes: Regular allocation/deallocation cycles
- Flat line sau cleanup: Successful memory recovery
Scripts phân tích tự động
Memory Monitoring Script
// Thêm vào test suite của bạn:
function monitorMemoryGrowth(durationMs = 60000) {
  const initial = process.memoryUsage();

  return new Promise((resolve) => {
    const interval = setInterval(() => {
      const current = process.memoryUsage();
      const growth = {
        rss: current.rss - initial.rss,
        heapUsed: current.heapUsed - initial.heapUsed,
        heapTotal: current.heapTotal - initial.heapTotal
      };

      console.log('Memory Growth:', {
        rss: `${Math.round(growth.rss / 1024 / 1024)}MB`,
        heapUsed: `${Math.round(growth.heapUsed / 1024 / 1024)}MB`
      });
    }, 5000);

    setTimeout(() => {
      clearInterval(interval);
      resolve(process.memoryUsage());
    }, durationMs);
  });
}

// Sử dụng:
await monitorMemoryGrowth(120000); // Monitor trong 2 phút
Best Practices cho Heap Analysis
1. Thiết lập Baseline
- Luôn tạo baseline snapshot trước khi testing
- Restart ứng dụng giữa các leak test khác nhau
- Sử dụng điều kiện testing nhất quán (cùng load, cùng time intervals)
2. Progressive Analysis
- Bắt đầu với leak durations nhỏ (30 giây)
- Tăng dần duration để xem growth patterns
- Dừng leaks trước khi system resources bị cạn kiệt
3. Cleanup Verification
- Tạo snapshots sau khi dừng leaks
- Xác minh memory trở về baseline levels
- Kiểm tra persistent objects mà lẽ ra đã được cleaned
4. Documentation
- Label snapshots rõ ràng với timestamps và actions
- Document các bước được thực hiện để reproduce mỗi leak
- Lưu heap dump files để so sánh sau này
Khắc phục sự cố thường gặp
Sự cố kết nối DevTools
# Nếu Chrome không thể kết nối Node inspector:
1. Kiểm tra firewall settings
2. Xác minh port 9229 đang mở
3. Thử inspector ports khác: --inspect=9230
4. Sử dụng --inspect-brk để pause on startup
Large Heap Dump Files
# Cho heap dumps lớn hơn 1GB:
1. Sử dụng Chrome Canary (hỗ trợ dumps lớn hơn)
2. Tăng Node.js memory limit: --max-old-space-size=8192
3. Tạo snapshots thường xuyên hơn để catch growth sớm
4. Tập trung vào specific object types thay vì full dumps
Memory không được Release
# Nếu memory không trở về baseline:
1. Force garbage collection: global.gc() (với --expose-gc)
2. Kiểm tra global variable pollution
3. Xác minh tất cả event listeners đã được removed
4. Tìm circular references trong heap dump
Tham khảo API Endpoints
Endpoints theo Pattern
Mỗi memory leak pattern theo cấu trúc API nhất quán:
POST /memory-leak/{pattern}/start  # Bắt đầu leak
POST /memory-leak/{pattern}/stop   # Dừng và cleanup
GET  /memory-leak/{pattern}/status # Lấy stats hiện tại
Trong đó {pattern} có thể là: timer, cache, closure, event, global-variable
Timer Memory Leaks
POST /memory-leak/timer/start
Bắt đầu một timer-based memory leak mới.
Response:
{
  "message": "Timer leak started",
  "stats": {
    "activeTimers": 1,
    "memoryAllocated": 0,
    "isLeaking": true
  }
}
GET /memory-leak/timer/status
Kiểm tra trạng thái hiện tại của timer leaks.
Response:
{
  "message": "Timer leak status",
  "stats": {
    "activeTimers": 2,
    "memoryAllocated": 160,
    "isLeaking": true
  }
}
POST /memory-leak/timer/stop
Dừng tất cả active timer leaks.
Response:
{
  "message": "Timer leak stopped",
  "stats": {
    "activeTimers": 0,
    "memoryAllocated": 0,
    "isLeaking": false
  }
}
Cache Memory Leaks
POST /memory-leak/cache/start
Bắt đầu cache memory leak bằng cách thêm large objects vào cache.
Response:
{
  "message": "Cache leak started",
  "stats": {
    "size": 1,
    "memoryUsage": "8MB",
    "maxSize": 1000
  }
}
GET /memory-leak/cache/stats
Lấy cache statistics chi tiết.
Response:
{
  "size": 15,
  "memoryUsage": "120MB",
  "maxSize": 1000,
  "isLeaking": true
}
Closure Memory Leaks
POST /memory-leak/closure/start
Tạo closures capture large data trong scope.
Response:
{
  "message": "Closure leak started",
  "stats": {
    "activeFunctions": 1,
    "memoryAllocated": 10,
    "isLeaking": true
  }
}
Event Listener Leaks
POST /memory-leak/event/start
Thêm event listeners với large closure data.
Response:
{
  "message": "Event leak started",
  "stats": {
    "activeListeners": 1,
    "totalMemoryAllocated": 8,
    "isLeaking": true
  }
}
POST /memory-leak/event/trigger
Trigger tất cả registered event listeners.
Response:
{
  "message": "Event triggered",
  "listenersNotified": 5
}
Global Variable Leaks
POST /memory-leak/global-variable/start
Tạo global variables tích lũy data.
Response:
{
  "message": "Global variable leak started",
  "stats": {
    "globalArrays": 1,
    "totalMemoryUsage": 8,
    "isLeaking": true
  }
}
Trạng thái tổng quan
GET /memory-leak/status
Lấy overview của tất cả memory leak patterns.
Response:
{
  "timestamp": "2025-09-06T10:30:00.000Z",
  "patterns": {
    "timer": {
      "message": "Timer leak status",
      "stats": {
        "activeTimers": 2,
        "memoryAllocated": 160,
        "isLeaking": true
      }
    },
    "cache": {
      "isLeaking": true,
      "stats": {
        "size": 15,
        "memoryUsage": "120MB",
        "maxSize": 1000
      },
      "message": "Cache status"
    },
    "closure": {
      "activeFunctions": 3,
      "memoryAllocated": 30,
      "isLeaking": true
    },
    "event": {
      "activeListeners": 4,
      "totalMemoryAllocated": 32,
      "isLeaking": true
    },
    "globalVariable": {
      "globalArrays": 2,
      "totalMemoryUsage": 16,
      "isLeaking": true
    }
  },
  "memory": {
    "rss": 245678080,
    "heapUsed": 156432384,
    "heapTotal": 178946048,
    "external": 2841600
  }
}
Debug Endpoints
POST /internal/debug/heapdump
Tạo heap dump để phân tích memory.
Headers:
x-admin-token: heapdump_demoResponse:
dump startedGhi chú:
- Yêu cầu admin token để bảo mật (được cấu hình qua
HEAPDUMP_TOKENenvironment variable) - Heap dumps được lưu vào thư mục
./heapdumps/ - Trả về status 202 và xử lý dump ở background
- Sử dụng Chrome DevTools hoặc heap analysis tools khác để kiểm tra
Ví dụ sử dụng
Testing Timer Leaks với Heap Analysis
# 1. Tạo baseline heap snapshot trong Chrome DevTools

# 2. Bắt đầu nhiều timer leaks (mỗi lần gọi tạo 1 timer mới)
curl -X POST http://localhost:3000/memory-leak/timer/start
curl -X POST http://localhost:3000/memory-leak/timer/start
curl -X POST http://localhost:3000/memory-leak/timer/start
curl -X POST http://localhost:3000/memory-leak/timer/start
curl -X POST http://localhost:3000/memory-leak/timer/start

# 3. Kiểm tra status để xem số lượng active timers
curl http://localhost:3000/memory-leak/timer/status

# 4. Tạo heap snapshot sau khi tạo timers

# 5. Tùy chọn tạo thêm timers và so sánh snapshots
curl -X POST http://localhost:3000/memory-leak/timer/start
curl -X POST http://localhost:3000/memory-leak/timer/start

# 6. Dừng leak
curl -X POST http://localhost:3000/memory-leak/timer/stop

# 7. Tạo final heap snapshot để xác minh cleanup
Hành vi mong đợi:
- Memory Growth: ~5MB được cấp phát mỗi giây mỗi active timer (buffers được GC)
- Heap Objects: Số lượng Timeout object = số lần gọi API
- Leak thực sự: Timer objects được giữ trong array, không phải temporary buffers
- Cleanup: Số lượng timer về 0, memory ổn định sau khi stopping
Testing nhiều Patterns đồng thời
# Bắt đầu nhiều leaks khác nhau
curl -X POST http://localhost:3000/memory-leak/timer/start
curl -X POST http://localhost:3000/memory-leak/cache/start
curl -X POST http://localhost:3000/memory-leak/event/start

# Kiểm tra overall status
curl http://localhost:3000/memory-leak/status

# Monitor trong 3 phút với heap snapshots

# Dừng tất cả leaks
curl -X POST http://localhost:3000/memory-leak/timer/stop
curl -X POST http://localhost:3000/memory-leak/cache/stop
curl -X POST http://localhost:3000/memory-leak/event/stop
Cache Leak Analysis Workflow
# 1. Baseline snapshot

# 2. Bắt đầu cache leak và thêm entries
curl -X POST http://localhost:3000/memory-leak/cache/start
curl -X POST http://localhost:3000/memory-leak/cache/start
curl -X POST http://localhost:3000/memory-leak/cache/start

# 3. Kiểm tra cache stats
curl http://localhost:3000/memory-leak/cache/stats

# 4. Tạo heap snapshot - tìm Map objects

# 5. Thêm entries nhiều hơn
for i in {1..10}; do
  curl -X POST http://localhost:3000/memory-leak/cache/start
done

# 6. Final snapshot và comparison
curl http://localhost:3000/memory-leak/cache/stats
Tạo Heap Dumps để phân tích
# Phương pháp 1: API endpoint (yêu cầu token)
curl -X POST \
  -H "x-admin-token: heapdump_demo" \
  http://localhost:3000/internal/debug/heapdump

# Phương pháp 2: Signal-based (macOS/Linux)
# Tìm Node.js process ID
ps aux | grep node | grep nestjs-demo

# Gửi USR2 signal để tạo heap dump
kill -USR2 <process_id>

# Phương pháp 3: Programmatic qua Chrome DevTools
# Sử dụng Chrome DevTools Memory tab -> Take heap snapshot
Giám sát và phân tích Memory
Giám sát Memory theo thời gian thực
Command Line Monitoring
# Giám sát Node.js process memory usage
watch -n 1 'ps aux | grep node | grep nestjs | grep -v grep'

# Giám sát system memory
watch -n 1 'free -h'

# Sử dụng htop cho interactive monitoring
htop -p $(pgrep -f nestjs-demo)
Application-Level Monitoring
// Thêm để giám sát memory trong ứng dụng của bạn
setInterval(() => {
  const usage = process.memoryUsage();
  console.log('Memory Usage:', {
    rss: `${Math.round(usage.rss / 1024 / 1024)} MB`,
    heapUsed: `${Math.round(usage.heapUsed / 1024 / 1024)} MB`,
    heapTotal: `${Math.round(usage.heapTotal / 1024 / 1024)} MB`,
    external: `${Math.round(usage.external / 1024 / 1024)} MB`
  });
}, 5000);
Patterns Memory mong đợi
Timer Leaks
- Tốc độ tăng trưởng: ~5MB được cấp phát mỗi giây mỗi active timer (buffer tạm thời được GC)
- Pattern: Tăng trưởng theo số lần gọi API, không phải thời gian chạy
- Cleanup: Timer count về 0 ngay lập tức, memory ổn định khi stopped
- Heap Objects: Timeout objects = số lần gọi API, buffer objects được GC định kỳ
Cache Leaks
- Tốc độ tăng trưởng: ~8MB mỗi cache entry
- Pattern: Tăng theo bước với mỗi cache addition
- Cleanup: Memory được released khi cache được cleared
- Heap Objects: Map objects với retained sizes lớn
Closure Leaks
- Tốc độ tăng trưởng: ~10MB mỗi closure function
- Pattern: Tăng trưởng incremental với mỗi closure creation
- Cleanup: Functions và scope data released khi cleared
- Heap Objects: Function objects với large retained contexts
Event Listener Leaks
- Tốc độ tăng trưởng: ~8MB mỗi event listener
- Pattern: Tăng trưởng theo bước với listener registration
- Cleanup: Listeners và associated data released on cleanup
- Heap Objects: EventEmitter với accumulated _events
Global Variable Leaks
- Tốc độ tăng trưởng: ~8MB mỗi global array/object
- Pattern: Tăng trưởng vĩnh viễn cho đến explicit cleanup
- Cleanup: Yêu cầu explicit global property deletion
- Heap Objects: Large arrays/objects attached to global scope
Tích hợp với Testing
Automated Memory Testing
// Ví dụ Jest test cho memory leak detection
describe('Memory Leak Detection', () => {
  it('should not leak memory with timer operations', async () => {
    const initialMemory = process.memoryUsage().heapUsed;

    // Bắt đầu timer leak
    await request(app)
      .post('/memory-leak/timer/start')
      .expect(201);

    // Đợi memory accumulation
    await new Promise(resolve => setTimeout(resolve, 5000));

    const duringLeakMemory = process.memoryUsage().heapUsed;
    expect(duringLeakMemory).toBeGreaterThan(initialMemory + 5 * 1024 * 1024); // 5MB growth

    // Dừng leak
    await request(app)
      .post('/memory-leak/timer/stop')
      .expect(201);

    // Cho phép cleanup
    await new Promise(resolve => setTimeout(resolve, 2000));
    global.gc && global.gc(); // Force GC nếu available

    const finalMemory = process.memoryUsage().heapUsed;
    expect(finalMemory).toBeLessThan(duringLeakMemory); // Memory nên giảm
  });
});
Ghi chú bảo mật và an toàn
Cân nhắc Production
- Không bao giờ deploy ứng dụng demo này lên production environments
- Remove debug endpoints trong production builds
- Secure admin tokens - thay đổi
HEAPDUMP_TOKENvalue mặc định - Monitor resource usage để tránh system exhaustion
Thực hành Testing an toàn
- Test ở isolated - sử dụng dedicated development/testing environments
- Đặt time limits - đừng chạy leaks vô hạn
- Monitor system resources - dừng tests nếu memory usage trở nên critical
- Clean up sau tests - luôn dừng active leaks khi hoàn thành
Resource Limits
# Đặt Node.js memory limits cho testing
node --max-old-space-size=4096 dist/main.js  # 4GB limit

# Monitor memory usage trong tests
while true; do
  memory=$(ps -o pid,vsz,rss,comm -p $(pgrep -f nestjs-demo) | tail -1 | awk '{print $3}')
  if [ "$memory" -gt 2000000 ]; then  # 2GB trong KB
    echo "Memory usage critical: ${memory}KB"
    break
  fi
  sleep 5
done
Khắc phục sự cố
Sự cố thường gặp
Port đã được sử dụng
# Tìm và kill processes sử dụng port 3000
lsof -ti:3000 | xargs kill -9

# Hoặc sử dụng port khác
PORT=3001 npm run start:dev
Ứng dụng trở nên không phản hồi
# Force stop tất cả leaks qua API
curl -X POST http://localhost:3000/memory-leak/timer/stop
curl -X POST http://localhost:3000/memory-leak/cache/stop
curl -X POST http://localhost:3000/memory-leak/closure/stop
curl -X POST http://localhost:3000/memory-leak/event/stop
curl -X POST http://localhost:3000/memory-leak/global-variable/stop

# Nếu API không phản hồi, restart process
pkill -f nestjs-demo
Heap Dump Generation thất bại
# Đảm bảo đủ disk space cho heap dumps
df -h ./heapdumps/

# Kiểm tra write permissions
ls -la ./heapdumps/

# Xác minh admin token
export HEAPDUMP_TOKEN=heapdump_demo
Sự cố kết nối Chrome DevTools
# Bắt đầu với specific inspector configuration
node --inspect=0.0.0.0:9229 --inspect-brk dist/main.js

# Thử ports khác nếu 9229 bị chiếm
node --inspect=0.0.0.0:9230 dist/main.js

# Kiểm tra firewall settings cho inspector port
Khắc phục sự cố Memory Analysis
Large Heap Dumps
- Sử dụng Chrome Canary cho large heap dump support
- Tăng Node.js memory limits:
--max-old-space-size=8192 - Tạo snapshots thường xuyên hơn để catch growth sớm
- Tập trung phân tích vào specific object types
Unexpected Memory Retention
- Kiểm tra global variable pollution
- Xác minh tất cả event listeners được properly removed
- Tìm circular references trong heap dumps
- Force garbage collection với
global.gc()(yêu cầu--expose-gc)
Analysis Performance Issues
- Filter heap dumps theo object type
- Sử dụng comparison view thay vì full analysis
- Tập trung vào objects với large retained sizes
- Tạo smaller, targeted snapshots
Tài liệu bổ sung
V8 Heap Dump Analysis Tools
- Chrome DevTools: Built-in memory profiling
- heapdump npm package: Programmatic heap dump generation
- clinic.js: Comprehensive Node.js performance analysis
- 0x: Flame graph generation cho CPU profiling